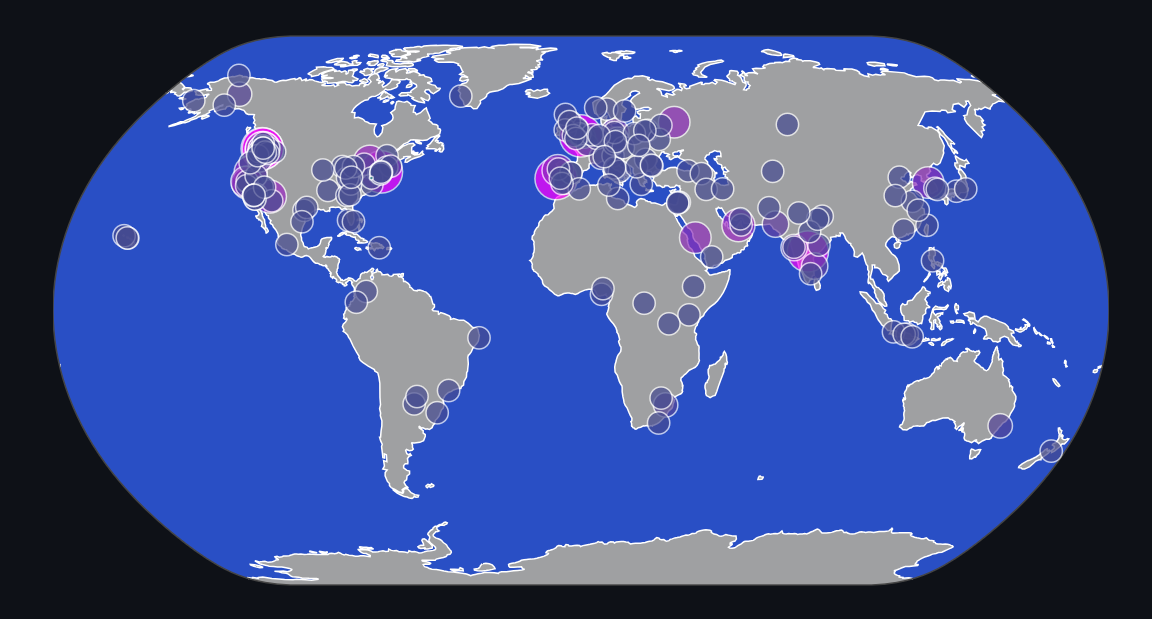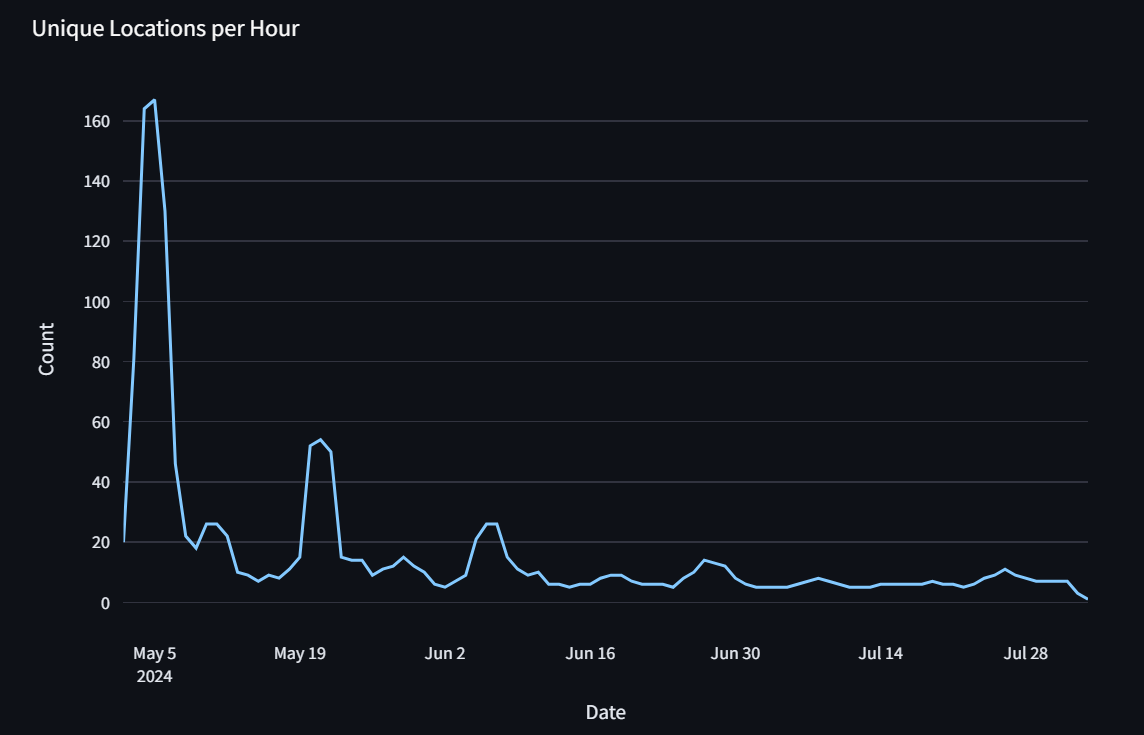
Exploring the data backing a web application leads to insights into how the system is actually running and whether it’s nearing any limits. It can provide ideas on how to improve the system in the future.
Exploring can be a challenging task when your backend and database don’t support the types of aggregations that can provide insights into high-level patterns.
Fortunately for me, weather.bingo is stored in a the SingleStore Free Shared Tier, and all the real-time analytical benefits SingleStore provides can power my exploration. What could it look like?
Try It Live! (interaction works best on desktop browsers).
Insights Via Streamlit
Streamlit is a many-starred project and related web service currently owned by Snowflake. Especially for Python lovers, it’s a low-barrier way to create and share data visualizations. Streamlit works best with a highly-responsive data source, so SingleStore is a great fit.
ChatGPT 4o is very good at writing Streamlit code. Ask for the visualization you are looking for, and it can provide! This is a great help, because with Streamlit you will spend 15 minutes getting your data frames, then an hour getting the charts to look perfect 😂.
For this use case, I just had to create three files representing the application. Once created,
python -m streamlit run app.py launches the app. Once it was ready, I published it to GitHub and
deployed it from https://streamlit.io/. Streamlit can also be self-hosted.
For the queries below, I used SingleStore’s MongoDB-compatible endpoint, SingleStore Kai, to query my data, but I could use SQL as well.
Note that this has revealed my usage is dropping significantly — please visit weather.bingo and help me out!
Code Listings
requirements.txt
pymongo==4.7.2
plotly==5.22.0
app.py
import streamlit as st
import pandas as pd
import plotly.express as px
from lib import init_connection, lk_names

st.set_page_config(page_title="weather.bingo cache analytics")

client = init_connection()
db = client.jtdb

lk_dict = lk_names()


def lk_to_name(lk):
    return lk_dict.get(lk, "Unknown Location")


def lk_to_lat(lk):
    return ((lk >> 16) - 9000) / 100


def lk_to_lon(lk):
    return ((lk & 0xFFFF) - 18000) / 100


st.markdown(
    f"""
    # weather.bingo cache analytics
    The [weather.bingo](https://weather.bingo/) service provides fast weather
    [with history](https://www.jasonthorsness.com/5) by caching weather data in
    [SingleStore](https://www.singlestore.com/), a high-performance distributed
    SQL database. This Streamlit application provides analytics on that cache.
    """
)

view = st.radio("Select View", ["calendar", "three-day"])
if view == "three-day":
    collection = "vcHours"
else:
    collection = "vcDays"

# Data Points by Location
pipeline = [
    {
        "$group": {
            "_id": "$_id.lk",
            "count": {"$count": 1},
            "first seen": {"$min": "$_id.date"},
            "last seen": {"$max": "$_id.date"},
        }
    },
    {"$sort": {"count": -1}},
]
df = db[collection].aggregate(pipeline)
df = pd.DataFrame(df)
df["lat"] = df["_id"].apply(lk_to_lat)
df["lon"] = df["_id"].apply(lk_to_lon)
df.insert(0, "name", df["_id"].apply(lk_to_name))
df.drop(columns=["_id"], inplace=True)

fig = px.scatter_geo(
    df,
    lat="lat",
    lon="lon",
    size="count",
    color="count",
    color_continuous_scale=[
        "#006666",
        "#FF00FF",
    ],
    projection="natural earth",
    hover_data={"name": True, "lat": True, "lon": True, "count": True},
)
fig.update(layout_coloraxis_showscale=False)
fig.update_layout(
    paper_bgcolor="rgba(0,0,0,0)",
    plot_bgcolor="rgba(0,0,0,0)",
    margin=dict(l=0, r=0, t=0, b=0),
    geo=dict(
        showcoastlines=True,
        coastlinecolor="white",
        showland=True,
        landcolor="rgba(255, 255, 255, 0.6)",
        showocean=True,
        oceancolor="rgba(50, 100, 255, 0.75)",
        lakecolor="rgba(24, 39, 59, 1)",
        bgcolor="rgba(0,0,0,0)",
    ),
)
st.write("Data Points by Location")
st.plotly_chart(fig)

# Unique Locations per Hour
pipeline = [
    {"$group": {"_id": "$_id.date", "count": {"$count": 1}}},
    {"$sort": {"_id": 1}},
]
df = db[collection].aggregate(pipeline)
df = pd.DataFrame(df)
fig = px.line(
    df,
    x="_id",
    y="count",
    labels={"_id": "Date", "count": "Count"},
)
fig.update_layout(margin=dict(t=0))
st.write("Unique Locations per Hour")
st.plotly_chart(fig)


# Most Common Weather
pipeline = []
if view == "three-day":
    pipeline = [
        {"$unwind": "$hours"},
        {"$group": {"_id": "$hours.icon", "count": {"$count": 1}}},
        {"$sort": {"count": -1}},
    ]
else:
    pipeline = [
        {"$group": {"_id": "$icon", "count": {"$count": 1}}},
        {"$match": {"_id": {"$ne": ""}}},
        {"$sort": {"count": -1}},
    ]
df = db[collection].aggregate(pipeline)
df = pd.DataFrame(df)
st.write("Most Common Weather")
st.write(df)
lib.py
import streamlit as st
import pymongo
import glob
import json
import os
import pathlib

@st.cache_resource
def init_connection():
    return pymongo.MongoClient(st.secrets["singlestore_kai_uri"])

# decode the weather.bingo city names
@st.cache_resource
def lk_names():
    cities = []
    for file in glob.glob(
        os.path.join(
            pathlib.Path(__file__).parent.resolve(), "cities/", "cities_*.json"
        )
    ):
        with open(file, "r", encoding="utf-8") as f:
            data = json.load(f)
            cities.extend(data)
    lks = []
    for file in glob.glob(
        os.path.join(
            pathlib.Path(__file__).parent.resolve(), "cities/", "lk_*.json")
    ):
        with open(file, "r", encoding="utf-8") as f:
            data = json.load(f)
            lks.extend(data)
    return {lk: city[3:].split("|")[0] for lk, city in zip(lks, cities)}

